The Trembling Earth

now at blogs.agu.org/tremblingearth

Yakko, Wakko, and Dot recount the Northridge quake

“It’s just the planet moving granite several city blocks.”

Our favorite cat/monkey/dogs reflect on their experience of L.A.’s 1994 temblor. Of course the Warner Brothers studios–where the writers work and the Animaniacs themselves live–is situated in the heart of Burbank, where shaking from the Northridge earthquake (on January 17, 1994, at 4:30 in the morning) was severe. In the early 90s L.A. truly established itself as the city of disaster by heaping mudslides upon fires upon riots upon disastrous quakes. But heck… we’re Californians.

…and just for all our records, and because they’re just so clever, here are the lyrics:

Animaniacs – A Quake! A Quake!

This is the city: Los Angeles, California

On a starlit winter night
When the moon was shining bright
Back in January of 1994 …
At 4:30 in the morning
And without a single warning
Something strange began to move the floor.

A quake! A quake!
The house begins to shake!
You’re bouncing ‘cross the floor and watching all your dishes break.

You’re sleeping, there’s a quake;
You’re instantly awake!
You’re leaping out of bed and shouting, “Oh for Heaven’s sake!”

I ran outside with neighbors
Their faces filled with shock
That’s because I’m standing there in NOTHING BUT MY SOCKS!

Oh a quake, a quake,
Say it’s all a big mistake!
Just feel the ground go up and down / Won’t someone hit the brake?

A quake, a quake!
Oh what a mess they make!
The bricks, the walls, the chimney falls / destruction in its wake.

I did not have insurance
So I called them from the scene
And suddenly I’m list’ning to an answering machine /
Say, ‘too late, too late!
You shouldn’t ought’a wait,
‘Cuz now you’re stuck, we wish you luck, here comes a six point eight.’

Whose fault? Whose fault?
The San Andreas’ fault.
Cuz Mister Richter can’t predict her / kicking our ass fault!

Seismologists all say tectonic plates are in between
An encroaching crust and mantle,
Yeah so what the heck’s that mean?!

It means a quake! A quake!
Oh really, yeah, no fake?
We kind of had that feeling when the ground began to shake….

California’s great!
It’s such a lovely state.
And every lawn is sitting on a continental plate.

Los Angeles had fires
And a riot and a flood
And then a drought and a recession and then now we hear this thud
Of a quake, a quake
How much more can we take?
We thought that we had seen it all but this one takes the cake.
The dirt. The rocks.
And all those aftershocks.
It’s just the planet moving granite several city blocks.

L.A. town is falling down
while the ground / moves around
We won’t let us get it down
We’re Californians.

A quake, a quake.
It’s time to pull up stake.
We’re all fed up we can’t deny it
Fires, quakes, and floods, and riots,
We want some place with peace and quieeeeeet…

So we’re moving to Beirut!

Follow me @TTremblingEarth

evolvetoTweetI’ve done it: I’ve taken the plunge into the Twittersphere. Tweet-a-sphere? Twit-osphere? Well anyway I plan to use Twitter to send out all the glorious little things I find neat and interesting and have nowhere near enough time to blog about, or which don’t really warrant a whole bunch of additional talk, like this and this and this (ew) and this (oh please at least click that last one).

My Twitter handle is TTremblingEarth, whose first ‘T’ you can view as either a contracted “The” or an appropriately tremulous stammer, but which was actually just necessary because apparently Trembling Earth is a band performing “psychedelic Americana, blues, and rock’n’roll from the swamps of Southern Georgia.” That sounds awesome actually.

So there you have it. If you’re on Twitter, you can find me doling out earthquakey tidbits there, whereas I’ll keep using the blog for material that merits a little more backstory. I think I’ll try to blog a weekly recap of my Twitter posts so those of you avoiding the service don’t have to totally miss out like you’re trying to. It seems to be a nice model for the fellows at Highly Allochthonous and Paleoseismicity, so–substantial overlap with them aside–I’ll do it too.

Remembering Northridge

Today is a day of significant quake anniversaries for the U.S. and Japan.

The last U.S. quake to kill more than a few people struck the L.A. suburb of Northridge 19 years ago today, in the wee hours of the morning. The San Fernando Valley was hit hard, but the whole L.A. area rattled violently, and seismic waves from The Valley were focused through the Santa Monica Mountains into the populous west side, an effect that’s apparent in the “Did-You-Feel-It” map if you’re familiar with the geography of L.A (click there for info if you aren’t. Or for fun if you are).

DYFINorthridge

Damage was widespread and many of the area’s freeways shut down for months after major collapses when their concrete supports failed during the strong shaking. Despite the huge monetary cost (right between hurricanes Andrew and Katrina… and potentially behind Sandy) and moderate death toll, this was not Los Angeles’ “big one.” In the scheme of possible So Cal earthquakes, this was a relatively small one, and rather than hitting the core of the city, it struck a glancing blow by starting in the suburbs and sending most of its energy northward into the mountains. Nonetheless it is Angelenos’ clearest reminder (although its age must have erased it largely from modern relevance) of what to expect when a significant quake strikes the city.

Exactly a year later a quake of nearly the same magnitude struck a much more densely populated corner of the planet: Kobe, Japan. This quake, almost identical in magnitude to CA’s Northridge earthquake of the year before, is the source of that quintessential earthquake footage most everyone will be familiar with:

The Kobe quake’s death toll was two orders of magnitude higher than Northridge’s, and the damage to the port city was devastating, largely because of widespread liquefaction, an effect that was much less prevalent in the coarse sedimentary basins of Mediterranean L.A.

As we mark this anniversary of those significant earthquakes, as usual you should take advantage of this heightened awareness to double-check that you’d be ready were a similar quake to happen today. Let the commemoration serve to remind you that these were real events that really happened, and could happen again at any moment.

An iconic photo of 90s L.A.

An iconic photo of 90s L.A.

Join my SSA special session: When and Why do Earthquake Ruptures Stop?

The clock is ticking on abstract submission for the April 17-19 annual meeting of the Seismological Society of America. Julian Lozos (of Seismogenic, and of course of the PhD program at UC Riverside) and I are convening one of the special sessions, entitled “When and Why Do Earthquake Ruptures Stop? Evaluating Competing Mechanisms of Rupture Termination.”

I highly encourage any of you who think you have answers to that question to submit an abstract for a poster or talk in our session.

The detailed request is below, but I’ll emphasize here that this question is near and dear to my heart as essentially the broad topic of my PhD dissertation research. I can describe that in a future post, but if you want to hear the deets, come to our session!

I should also emphasize that the deadline is seriously rapidly approaching: Thursday, January 10 at 5pm Pacific (UTC -8)!   Eek!

SSA 2013 Special Session:

When and Why do Earthquake Ruptures Stop? Evaluating Competing Mechanisms of Rupture Termination

Summary:

Cessation of coseismic fault rupture has been suggested to result from a variety of mechanisms, ranging from fault-specific static properties to transient, rupture-history-driven dynamic effects. Field and modeling evidence alike implicate static or quasi-static properties such as fault geometry, frictional asperities or regions of creep, and time-dependent poro-elasticity as strong controls on rupture endpoints. However, static, dynamic, and quasi-dynamic numerical models, as well as mounting instrumental and field evidence demonstrate that, as stress evolves over multiple seismic cycles, transient effects may periodically overcome established static barriers, allowing rupture to continue. While much work has been done to investigate the effects of individual mechanisms on rupture cessation, the next step is to merge disparate studies of competing mechanisms in order to understand their relative roles within a given fault system. We invite presentations that summarize findings from numerical models, laboratory tests, observational analyses, and field and paleoseismic investigations that address various mechanisms that inhibit earthquake ruptures. We encourage comparison of these effects with one another, as well as discussion of how to evaluate which properties may dominate rupture through a given fault system, and of how to determine which effects are persistent over multiple earthquake cycles.

Conveners:

Austin Elliott (University of California Davis, ajelliott@ucdavis.edu)

Julian Lozos (University of California Riverside, jlozo001@student.ucr.edu)

See you in Salt Lake City!

Trembling Ice: The largest glacier you’ve ever seen collapse

An iceberg calves off of Ilulissat glacier in Greenland. Photo credit: Martin Truffer/University of Alaska-Fairbanks

Straying briefly into the hydrosphere, I’d like to bring to your attention a video of an event that no doubt trembled the Earth for miles around, and wrought seismic and tectonic havoc on the Ilulissat glacier in Greenland.

In the course of capturing footage and ice-cap scenes for their new and acclaimed movie “Chasing Ice“, a team of young sciency filmmakers/photographers witnessed the most enormous collapse of a glacier ever recorded on video. And they had dozens of cameras rolling. It just doesn’t get better than this.

The scale of what unfolds in this video is simply incredible, and I will be booking my ticket to go see this film as soon as possible.

I could go on marveling at the sheer scale and scope and sound and sight of the ice breaking up, but the video speaks for itself, so I’ll stop here and let you all go admire. Keep in mind two things: ice is less dense than water (more buoyant), but only just enough that a mere 10% of an icy mass rises above the liquid water it floats in. Secondly… you’ve never seen anything like this, at least outside of Spielberg.

(High-definition version at link below)

Head over to The Guardian to watch the original high-def clip and enjoy. I know I did. Over and over.

Chasing Ice movie reveals largest iceberg break-up ever filmed – Guardian UK

Twitter and the 21st century earthquake

You thought seismic waves were fast… you should see Twitter! The social microblogging service increasingly serves as a communication conduit between emergency management agencies and individuals during crises. The USGS has begun to exploit Twitter, both to dispatch earthquake information and in turn to collect tweets that show an earthquake has occurred, potentially before the relatively sparse network of seismometers detects and reports it. A couple of years ago USGS scientists Paul Earle, Michelle Guy, and their colleagues reported their preliminary evaluation of a system that culls tweets containing the word “earthquake” from the vicinity of a known quake epicenter. The results were strikingly effective at highlighting the epicentral region of the quake, indicated by the largest jump in the frequency of “earthquake”-related tweets. Their article is publicly available and explains the benefits and drawbacks of a Twitter-based earthquake detection system. It’s well worth a read. OMG Earthquake! Can Twitter Improve Earthquake Response? The article contains perhaps my favorite sentence of any academic paper I’ve read:

The first geocoded tweet about the earthquake arrived 19 seconds after the origin time and reported omfg, earthquake.”

Their supplemental material makes for an entertaining read, listing 360 seconds of tweets containing “earthquake” that followed the 2009 M4.3 Morgan Hill quake in the Bay Area. Electronic Supplement to Earle et al., 2010 While thoroughly exploring the caveats of twitter quake detection such as the general lack of true shaking records, including the fact that shaking intensity is unreported or unreliable, the authors demonstrate the powerful comparison of Twitter response times to the average reporting delays of even our fastest instrumental networks. Whereas tweets are published with a lag time of ~5 seconds, official USGS earthquake solutions are only made available minutes after an earthquake. Commonly in disasters, small data transmissions via mobile devices offer the only functional way to disseminate information, since power and telephone lines may be disrupted and data-heavy voice calls may overwhelm cell networks. Many people on both coasts may have a familiar experience in mind following moderate earthquakes: even with light shaking and no damage, the excitement stirred up by a temblor results in an overloaded cell network incapable of supporting your phone calls. It can be hours before phone calls go through.

Click to access www2010.pdf

60 hours until the Not-pocalypse

This morning I woke up to this alarming warning, reminding me that the world as we know it will come to an end on Friday.

As seen on the internets.

As seen on the internets.


Fortunately my nerves have been calmed by all manner of authorities reminding me in official terms that the world is in all likelihood not going to end on Friday. Phew. Dodged a bullet there.

what could have been...

A new subway? In L.A.??

First off, the U.S. government says it’ll be okay:

Scary Rumors about the World Ending in 2012 Are Just Rumors – USA.gov

The modern Maya themselves are downplaying the concerns:

Even the Maya are getting sick of the hype – MSNBC

And finally, even more authoritative sources weigh in with some informed messages, just in case you have really detailed concerns to dispel:

USGS: Will the World End on December 21? (“beliefs aside, what we know with certainty is that Earth has a tremendous capacity to generate natural disasters on any day of any year.”)

NASA: The Great 2012 Doomsday Scare (this one includes great historical examples of not-pocalypses past)

NASA and the USGS are both well versed in the doomsday phenomena that threaten our planet. Other than the changing climate, most of these natural catastrophes are local or regional doomsdays, not the end of “the world” per se, but certainly the end of the world for some. It’s encouraging to see these agencies step forward and use the hype (as silly or as serious as it may be) as an opportunity to inform and do some checking in about what we really do know can harm us and what we really do know about how to deal with it.

While you’re preparing for the fake end of the world, take a moment and make sure you know what to do if a real disaster struck your home.

Watch the ground ripple in Long Beach

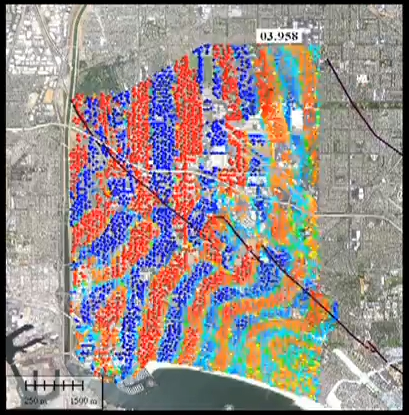
As the seismic waves from a whole host of little earthquakes in L.A. rippled through the basin in 2011, an astonishingly dense array of seismometers deployed in Long Beach captured them in unprecedented detail. Local oil and gas company Signal Hill Petroleum deployed the monitoring instruments in order to conduct an extremely detailed survey of the 3D rock structure beneath their oil fields. Researchers from Caltech and Berkeley struck an agreement with the oil company to share the data for academic research into the earthquake process and details of fault behavior. One of the results of this research is the amazing video below, in which we can see the elastic (seismic) waves of several earthquakes as they propagate from the hypocenter and rock the city block by block. Note that the initial playback is in real time, not sped up or slowed down. Skip around to see each of the 4 quakes without watching all 12 minutes: the individual quakes start at 0:45, 2:20, 6:00, and 8:35.

The seismometers of this network–in this case relatively inexpensive geophones, measuring vertical ground velocity–are located a mere 100 meters apart, creating a network with several instruments per city block! Because of this amazingly dense coverage, we can see the great gory detail of waves of motion moving through the rock underfoot.

In the videos, they have drawn the trace of the Newport-Inglewood Fault, a notable northwest striking strike-slip fault (the source of the 1933 Long Beach earthquake). One of the most notable features of the wavefields displayed in the videos is how drastically this fault zone alters the propagating waves.

Seismic waves from a nearby M2.5 earthquake ripple across the city of Long Beach in this visualization of an unprecedented dense array of seismometers.

Seismic waves from a nearby M2.5 earthquake ripple across the city of Long Beach in this visualization of an unprecedented dense array of seismometers.

When they travel along the fault, they speed up in the fault zone, likely due to alignment of mineral grains and rock structural boundaries in the direction of slip. When the waves have to cross the fault, they get held back and slowed down, forming an irregular jog or knick in the wavefield. This hold-up is probably partially due to that same alignment of grains, now traveling along their short axes, but it’s also due in part to “microslip” along the fault. As the rock on one side bends with elastic waves, the fault accommodates a bit of slip before letting the wave propagate past. The researchers are studying this effect as well, and have begun to map out regions of slip on the N-I fault during adjacent temblors.

It’s rather beautiful, really, to see that this mapped fault has a real physical effect, validating its presence and importance. It’s also endlessly fascinating to watch the details of real seismic waves passing beneath the city of Long Beach. This is how the ground moves in an earthquake.

More info about the research coming out of this awesome data can be found here:

http://www.gps.caltech.edu/~clay/LB3D/LB3D.html

Thanks to Chris Rowan and Cristoph Grützner for bringing this one to my attention.

Update: If you’re now hooked on this kind of visualization, fret not: the Incorporated Research Institutions for Seismology produce these regularly using seismic data from the US Array. Though not at a block-by-block resolution, the animations come from impressive coverage on a spectacularly dense instrumental array, in which you can see the imperceptible seismic waves from distant earthquakes roll beneath the U.S.

Check them out after big quakes! http://www.iris.edu/spud/gmv

Earthquakes as weathering agents: the rubbing boulders of the Atacama

A fairly unique study came out a few months ago in the journal Geology, in which the authors propose a novel mechanism of erosion: abrasion during earthquake shaking.

Seismicity and the strange rubbing boulders of the Atacama desert, northern Chile

The researchers were puzzled by fields of boulders sitting hardly buried atop the silty floor of Chile’s hyper-arid Atacama desert. They noted odd “moats” in broken silt crust around the boulders, and odd patterns of smoothing around only portions of the boulders’ sides. While they were out documenting these patterns they witnessed a M5.2 earthquake (centered 100km away) rock the landscape, swaying the boulders and producing a clattering roar as the rocks clapped into one another.

A boulder field in the barren Atacama desert displays evidence of clattering clasts, rubbed smooth by collisions during earthquakes. Photo by Jay Quade, hosted on www.geosociety.org

A boulder field in the barren Atacama desert displays evidence of clattering clasts, rubbed smooth by collisions during earthquakes. Photo by Jay Quade, hosted on http://www.geosociety.org

So… they proposed that shaking by the rather frequent Chilean earthquakes causes these rocks to rub each other, and over literally millions of years they wear each other smooth at their points of contact. A back-of-the-envelope calculation estimates that these rocks have shaken for up to 70,000 hours of their 1.3 million-year existences on this surface. That should be plenty of time to wear each other smooth, if it’s what’s really going on.

If you can read the article, note that I find their Figure 2E the most compelling, showing the abraded corner of one boulder sitting nestled into a conformable, abraded concavity on a neighboring boulder. Still, I’m not entirely convinced that the authors have ruled out wind-borne sand abrasion as a cause of much of this wear. Their main arguments against it are the localization of abrasion around the mid-sections of boulders (whereas wind-abraded ventifacts are presumably more thoroughly smoothed all around), and the broken silt crust in the moats, which would be expected to be homogeneous sand if the moats were formed by wind, with the finer silt blown away. Without more detailed documentation of the features, I’m not fully convinced that these uneven patterns of abrasion cannot still be explained by localized concentration of high-speed sand grains, concentrated in narrow gaps between boulders or low along the ground in the layer of heavy saltating grains.

That doubt expressed, I fully accept that their suggested mechanism is in fact an agent of boulder smoothing and erosion: they have anecdotal evidence that it occurs, and I think basic physics requires the rocking and colliding of these rocks, leading to thorough abrasion over repeated shaking through geologic time. Heck, there’s all kinds of evidence of boulder motion during quakes, from the bouncing pock marks I saw after the El Mayor Cucapah earthquake, to this classic toppled boulder in the Eastern Sierra.

Rocks loosened from the hillside during a M7.2 earthquake leave trails of divots where they bounced down into a wash.

Rocks loosened from the hillside during a M7.2 earthquake leave trails of divots where they bounced down into a wash.

The trail of a boulder, knocked during a M6 1980 earthquake from its perch atop a fault scarp, leads directly to the boulder in its resting place behind a camp site shell along McGee Creek, California.

Their final discussion makes some key points: 1) in most places on Earth, water, wind, and ice erosion act much more quickly than seismic events recur, meaning that any evidence of clattering rocks is overwhelmed and erased by the more efficient modes of erosion. 2) On barren, dry, rocky planets where water erosion does not occur, seismic abrasion may actually be a dominant mode of both smoothing and transport of clasts. In fact scientists earlier this year suggested this very notion based on photographic evidence from Mars, where fields of displaced boulders (with trails!) were concentrated around seismic fault lines.

What do you think? Are the smooth bands around the rocks explained by rubbing during earthquakes? We’ve seen weirder things….

Animations and Sonifications of the Tohoku earthquake and aftershocks

The M9.0 Tohoku earthquake that roared through Japan on March 11, 2011 made its presence felt in various ways throughout the planet. The ground rippled, the ocean churned, and even the atmosphere undulated with heavy pressure waves as the force of this sudden lurch of the Earth’s crust radiated outward from its source off the coast of Japan.

[Put your headphones on now.]

Scientists all over the world have taken data of all stripes and turned them into illustrative visualizations–like the examples listed above–of the extent of this seismic event. Most of these are old news, but for some reason I thought of them today, so here they are for your illumination.

One of the most captivating effects of this earthquake–and of any–is the aftershock sequence it unleashed. Aftershocks represent the relief of intense local stresses left by the abrupt perturbation of a mainshock, and they unfold in a statistically predictable manner (there’s a fun presentation by USGS scientist Karen Felzer explaining the remarkable features of aftershock sequences here). Despite this statistical order, in our relatively fast-paced human timescale, we may still perceive them as startling and chaotic, especially when we’re on edge in the aftermath of a major quake. Sped-up animations of earthquake occurrence (“seismicity”) help illustrate the decay in frequency and size of aftershocks with time, as well as simply illustrating just how numerous they may be after a large mainshock.

This video shows one year of earthquakes greater than magnitude 4.5 around the globe. Many mainshock-aftershock sequences are apparent, but by far the most spectacular is the series of quakes that is induced by the gargantuan Tohoku earthquake. Enjoy.

This same group has produced several other videos, either covering different time spans, or zooming in to Japan. Have a look at their website:

http://monoroch.net/jishin2011/

One of my favorite videos of this flavor is the “sonification” of seismic records from the day of the quake, like the one at the beginning of this post. Earthquakes shake the ground at frequencies lower than human hearing (infrasonic), but if we simply speed up the playback of seismic records, and translate their motions into oscillation of a speaker cone, we get the “sound” of the earthquakes. In that “sonification” video you see seismograms from four different stations in Japan and Russia that record the mainshock and the onslaught of aftershocks–including a 7.9–that follow. The inset map shows energetic yellow glows surrounding each station that are scaled to reflect the amplitude of the seismic waves recorded there.

If those aren’t enough coolness for you, there’s a whole page of different “sonifications” compiled by a Georgia Tech researcher illustrating different phenomena associated with the monster quake. Several of the clips play regional recordings of the mainshock and its aftershocks, but the compilation continues into recordings from the other side of the planet, where seismometers in California recorded the San Andreas Fault creaking and shuffling with triggered tremor as the long slow elastic waves from Tohoku swept through.

A seismic record section and frequency spectrogram show the first hour following the Tohoku quake. Click the image for the movie with audio. Quicktime format. The link to other videos and formats is below.

Earthquake Sound of the Mw9.0 Tohoku-Oki, Japan earthquake

If you’re into these sorts of things, there are more to be found… The California Integrated Seismic Network has some sped-up recordings of the 2004 M6.0 Parkfield earthquake and its aftershocks, at http://www.cisn.org/special/evt.04.09.28/sounds.html