The Trembling Earth

now at blogs.agu.org/tremblingearth

Category Archives: Earthquake Physics

On my way to SSA

This week I’m attending the Seismological Society of America annual meeting in Salt Lake City, Utah. The society was founded in the wake of the 1906 San Francisco earthquake, so the annual meetings generally coincide with the quake’s April 18 anniversary.

20130416-165449.jpg

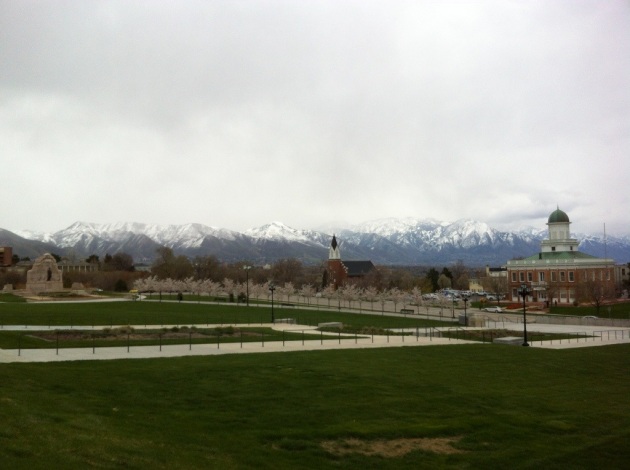
Salt Lake City’s pioneer past is still evident overlooking the Wasatch front from the Utah State Capitol

This year’s conference is held in Salt Lake City, at the foot of the gorgeous and seismically ominous Wasatch Mountains. As such the conference is nominally focused on earthquake hazards in the U.S. intermountain west. The organizers have done a marvelous job arranging events, public lectures, and coordinating with Utah’s statewide ShakeOut drill on Wednesday in order to raise public awareness of the risks posed by the Wasatch Fault.

Below are details on the two big public events, if you’re in Utah and looking for some straight-from-the-source earthquake info. I’ll report more throughout and after the week on other goings-on at the conference, including the discussion and results from my own session on what stops earthquake ruptures, and a big field trip to see the Wasatch fault and SLC’s seismic preparedness on Saturday.

Public Events
The Great Utah ShakeOut
http://www.shakeout.org/utah/
Wednesday, April 17
10:15am
Everywhere – under a table!

Town Hall Meeting
http://www.seismosoc.org/meetings/2013/townhall.php
Wednesday, April 17
7:30-9:00pm
Downtown Radisson – Wasatch ballroom

Sunday Reading #3

Apologies for the tardiness. I suppose for some of you this is Sunday evening reading, if that’s what people even do on Sunday evenings. Maybe for those of you hunkering down in the U.S. midwest.

Here are two weeks’ worth of seismic tidbits I posted on Twitter, since the first week was a little dry. Catch up on all things quakey!

Overcompensating in L’Aquila
In oh-so-foreseeable news, Italian officials are now trigger-happy with evacuation orders in the wake of the manslaughter conviction of seismic hazard officials. Caution is good… but, this is why we have legends like the boy who cried wolf.

“Why evacuate for an earthquake no one can feel?”
http://www.bbc.co.uk/news/magazine-22039903

A nice antidote to that painful bit of news is a call to arms about the risky state of building design in such a quake-prone region:
http://www.csmonitor.com/World/Europe/2012/0521/Italy-earthquake-modern-buildings-not-ancient-ones-pose-biggest-threat-video

Man-made Earthquakes
The seismic hot-topic of the decade, human-induced earthquakes, gets a summary treatment by Popular Mechanics. The summary is good. You’ll be hearing more about this from me and all of us in the future:
http://www.popularmechanics.com/science/energy/coal-oil-gas/how-big-could-a-man-made-earthquake-get-15299728

“Rolling” versus “sharp” earthquakes, explained

“The Earthquake Machine”
How do you scale down faults so that you can understand their frictional and mechanical behavior in controlled tests? Popular Science has a neato infographic on the equipment used in rock mechanics tests–earthquake laboratories.
http://www.popsci.com/technology/article/2013-03/earthquake-machine

Earthquakes and Society
Christchurch residents and architectural pros alike balk at the rebuild designs for the downtown cathedral:
http://www.dezeen.com/2013/04/08/critics-back-restoration-of-earthquake-christchurch-cathedral/

Nepal introduces an emergency plan for a crucial post-quake lifeline, its airport:
http://www.irinnews.org/Report/97766/Priming-Nepal-s-airport-for-earthquake

Exposé of an ethically questionable but increasingly common industry–disaster tourism:
http://travel.nytimes.com/2013/04/07/travel/tourism-in-javas-land-of-ghosts.html

Animal earthquake predictors
There has been a modest buzz this week about research on a longstanding legend of seismic phenomena. Animals have occasionally been reported to appear to foretell earthquakes, but anecdotal evidence generally fails any rigorous scientific test, and most such observations are thus dismissed as unreliable indicators of any impending quake. Researchers in Germany, however, have begun to study ants that live in colonies along fault lines. Surprising finding: their level of activity changes from a daily average before small tremors. I wouldn’t make too much of this yet, but I think it’s really cool to finally see some potential for scientific tests of a long-standing, intractable myth/puzzle about quake phenomena. Now if only we could fill all our fault lines with German Redwood ants…. I wonder if they distinguish between magnitude 2 and magnitude 7…

The news release:
http://www.ouramazingplanet.com/4360-ants-sense-earthquakes.html

The researchers’ website:
http://www.uni-due.de/geology/research/ants_earthquakes.shtml

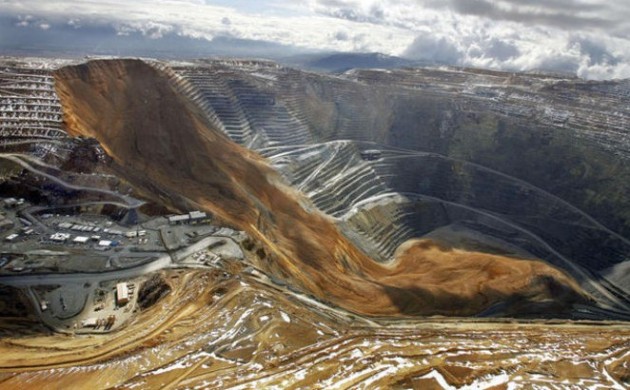
Landslide in Utah Copper Mine

Quarry collapse at the Bingham Copper Mine, Utah

Quarry collapse at the Bingham Copper Mine, Utah

A noteworthily massive collapse occurred this week at a quarry outside of Salt Lake City, Utah. The event is outside of my scientific jurisdiction, but Dave Petley has been covering it with great interest, and has reported a bit about the seismic signature of this mighty landslide:
http://blogs.agu.org/landslideblog/2013/04/12/the-unusually-large-bingham-canyon-mine-landslide-an-impressive-example-of-prediction-using-monitoring/

Honshu quake

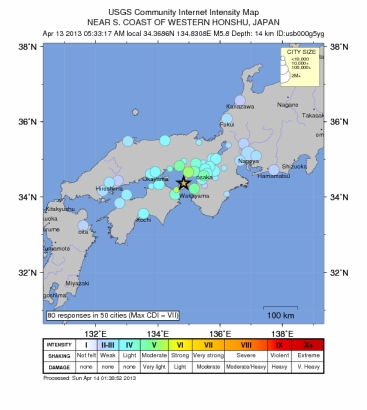
DYFI130413Honshu

A modest but substantial 5.8 tremor rattled the southern Japanese island of Honshu this week, doing a fair bit of damage on Awaji island and the densely populated area surrounding it. A collection of videos record the shaking from a few urban cameras, the second of which demonstrates the noise created by a rattling city:

YouTube user KOJI PEI posted a video showing a real-time (actually ~2 or 3x speed) animation of shaking intensity at each of Japan’s seismometers during this quake. I’m not sure where this video came from nor how specifically it was generated (it appears to be maximum acceleration averaged over a several second time window), but I’m hoping to find out and to find more like it. You can see seismic waves radiate outward from the epicenter, with the relatively gentle P-waves leading the charge, and swishy S-waves ringing outward behind them.

Seismic engineering – For your Office, Museum, or Bedroom!
Scaled down base isolators can secure servers, lab apparati, antiques etc. on specialized tables.
http://gizmodo.com/5994528/watch-this-anti+earthquake-table-shrug-off-a-violent-simulated-tremor 

The principle of base isolation is already successfully applied in buildings around the world, and this mini-version may be hugely popular with companies and museums whose equipement and specimens need to be seismically protected. One of the commenters also has some insightful things to add, including the major deficiencies in maximum displacement and vertical protection.

Big news on a big move this week – I’ll update you all shortly!

Join my SSA special session: When and Why do Earthquake Ruptures Stop?

The clock is ticking on abstract submission for the April 17-19 annual meeting of the Seismological Society of America. Julian Lozos (of Seismogenic, and of course of the PhD program at UC Riverside) and I are convening one of the special sessions, entitled “When and Why Do Earthquake Ruptures Stop? Evaluating Competing Mechanisms of Rupture Termination.”

I highly encourage any of you who think you have answers to that question to submit an abstract for a poster or talk in our session.

The detailed request is below, but I’ll emphasize here that this question is near and dear to my heart as essentially the broad topic of my PhD dissertation research. I can describe that in a future post, but if you want to hear the deets, come to our session!

I should also emphasize that the deadline is seriously rapidly approaching: Thursday, January 10 at 5pm Pacific (UTC -8)!   Eek!

SSA 2013 Special Session:

When and Why do Earthquake Ruptures Stop? Evaluating Competing Mechanisms of Rupture Termination

Summary:

Cessation of coseismic fault rupture has been suggested to result from a variety of mechanisms, ranging from fault-specific static properties to transient, rupture-history-driven dynamic effects. Field and modeling evidence alike implicate static or quasi-static properties such as fault geometry, frictional asperities or regions of creep, and time-dependent poro-elasticity as strong controls on rupture endpoints. However, static, dynamic, and quasi-dynamic numerical models, as well as mounting instrumental and field evidence demonstrate that, as stress evolves over multiple seismic cycles, transient effects may periodically overcome established static barriers, allowing rupture to continue. While much work has been done to investigate the effects of individual mechanisms on rupture cessation, the next step is to merge disparate studies of competing mechanisms in order to understand their relative roles within a given fault system. We invite presentations that summarize findings from numerical models, laboratory tests, observational analyses, and field and paleoseismic investigations that address various mechanisms that inhibit earthquake ruptures. We encourage comparison of these effects with one another, as well as discussion of how to evaluate which properties may dominate rupture through a given fault system, and of how to determine which effects are persistent over multiple earthquake cycles.

Conveners:

Austin Elliott (University of California Davis, ajelliott@ucdavis.edu)

Julian Lozos (University of California Riverside, jlozo001@student.ucr.edu)

See you in Salt Lake City!

Watch the ground ripple in Long Beach

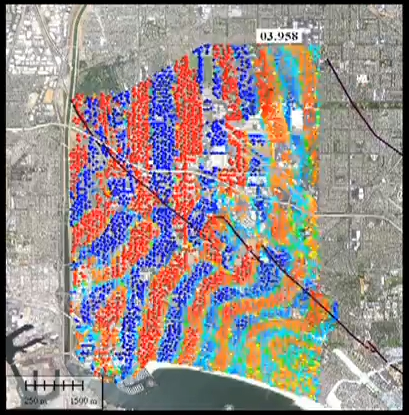
As the seismic waves from a whole host of little earthquakes in L.A. rippled through the basin in 2011, an astonishingly dense array of seismometers deployed in Long Beach captured them in unprecedented detail. Local oil and gas company Signal Hill Petroleum deployed the monitoring instruments in order to conduct an extremely detailed survey of the 3D rock structure beneath their oil fields. Researchers from Caltech and Berkeley struck an agreement with the oil company to share the data for academic research into the earthquake process and details of fault behavior. One of the results of this research is the amazing video below, in which we can see the elastic (seismic) waves of several earthquakes as they propagate from the hypocenter and rock the city block by block. Note that the initial playback is in real time, not sped up or slowed down. Skip around to see each of the 4 quakes without watching all 12 minutes: the individual quakes start at 0:45, 2:20, 6:00, and 8:35.

The seismometers of this network–in this case relatively inexpensive geophones, measuring vertical ground velocity–are located a mere 100 meters apart, creating a network with several instruments per city block! Because of this amazingly dense coverage, we can see the great gory detail of waves of motion moving through the rock underfoot.

In the videos, they have drawn the trace of the Newport-Inglewood Fault, a notable northwest striking strike-slip fault (the source of the 1933 Long Beach earthquake). One of the most notable features of the wavefields displayed in the videos is how drastically this fault zone alters the propagating waves.

Seismic waves from a nearby M2.5 earthquake ripple across the city of Long Beach in this visualization of an unprecedented dense array of seismometers.

Seismic waves from a nearby M2.5 earthquake ripple across the city of Long Beach in this visualization of an unprecedented dense array of seismometers.

When they travel along the fault, they speed up in the fault zone, likely due to alignment of mineral grains and rock structural boundaries in the direction of slip. When the waves have to cross the fault, they get held back and slowed down, forming an irregular jog or knick in the wavefield. This hold-up is probably partially due to that same alignment of grains, now traveling along their short axes, but it’s also due in part to “microslip” along the fault. As the rock on one side bends with elastic waves, the fault accommodates a bit of slip before letting the wave propagate past. The researchers are studying this effect as well, and have begun to map out regions of slip on the N-I fault during adjacent temblors.

It’s rather beautiful, really, to see that this mapped fault has a real physical effect, validating its presence and importance. It’s also endlessly fascinating to watch the details of real seismic waves passing beneath the city of Long Beach. This is how the ground moves in an earthquake.

More info about the research coming out of this awesome data can be found here:

http://www.gps.caltech.edu/~clay/LB3D/LB3D.html

Thanks to Chris Rowan and Cristoph Grützner for bringing this one to my attention.

Update: If you’re now hooked on this kind of visualization, fret not: the Incorporated Research Institutions for Seismology produce these regularly using seismic data from the US Array. Though not at a block-by-block resolution, the animations come from impressive coverage on a spectacularly dense instrumental array, in which you can see the imperceptible seismic waves from distant earthquakes roll beneath the U.S.

Check them out after big quakes! http://www.iris.edu/spud/gmv

Earthquakes as weathering agents: the rubbing boulders of the Atacama

A fairly unique study came out a few months ago in the journal Geology, in which the authors propose a novel mechanism of erosion: abrasion during earthquake shaking.

Seismicity and the strange rubbing boulders of the Atacama desert, northern Chile

The researchers were puzzled by fields of boulders sitting hardly buried atop the silty floor of Chile’s hyper-arid Atacama desert. They noted odd “moats” in broken silt crust around the boulders, and odd patterns of smoothing around only portions of the boulders’ sides. While they were out documenting these patterns they witnessed a M5.2 earthquake (centered 100km away) rock the landscape, swaying the boulders and producing a clattering roar as the rocks clapped into one another.

A boulder field in the barren Atacama desert displays evidence of clattering clasts, rubbed smooth by collisions during earthquakes. Photo by Jay Quade, hosted on www.geosociety.org

A boulder field in the barren Atacama desert displays evidence of clattering clasts, rubbed smooth by collisions during earthquakes. Photo by Jay Quade, hosted on http://www.geosociety.org

So… they proposed that shaking by the rather frequent Chilean earthquakes causes these rocks to rub each other, and over literally millions of years they wear each other smooth at their points of contact. A back-of-the-envelope calculation estimates that these rocks have shaken for up to 70,000 hours of their 1.3 million-year existences on this surface. That should be plenty of time to wear each other smooth, if it’s what’s really going on.

If you can read the article, note that I find their Figure 2E the most compelling, showing the abraded corner of one boulder sitting nestled into a conformable, abraded concavity on a neighboring boulder. Still, I’m not entirely convinced that the authors have ruled out wind-borne sand abrasion as a cause of much of this wear. Their main arguments against it are the localization of abrasion around the mid-sections of boulders (whereas wind-abraded ventifacts are presumably more thoroughly smoothed all around), and the broken silt crust in the moats, which would be expected to be homogeneous sand if the moats were formed by wind, with the finer silt blown away. Without more detailed documentation of the features, I’m not fully convinced that these uneven patterns of abrasion cannot still be explained by localized concentration of high-speed sand grains, concentrated in narrow gaps between boulders or low along the ground in the layer of heavy saltating grains.

That doubt expressed, I fully accept that their suggested mechanism is in fact an agent of boulder smoothing and erosion: they have anecdotal evidence that it occurs, and I think basic physics requires the rocking and colliding of these rocks, leading to thorough abrasion over repeated shaking through geologic time. Heck, there’s all kinds of evidence of boulder motion during quakes, from the bouncing pock marks I saw after the El Mayor Cucapah earthquake, to this classic toppled boulder in the Eastern Sierra.

Rocks loosened from the hillside during a M7.2 earthquake leave trails of divots where they bounced down into a wash.

Rocks loosened from the hillside during a M7.2 earthquake leave trails of divots where they bounced down into a wash.

The trail of a boulder, knocked during a M6 1980 earthquake from its perch atop a fault scarp, leads directly to the boulder in its resting place behind a camp site shell along McGee Creek, California.

Their final discussion makes some key points: 1) in most places on Earth, water, wind, and ice erosion act much more quickly than seismic events recur, meaning that any evidence of clattering rocks is overwhelmed and erased by the more efficient modes of erosion. 2) On barren, dry, rocky planets where water erosion does not occur, seismic abrasion may actually be a dominant mode of both smoothing and transport of clasts. In fact scientists earlier this year suggested this very notion based on photographic evidence from Mars, where fields of displaced boulders (with trails!) were concentrated around seismic fault lines.

What do you think? Are the smooth bands around the rocks explained by rubbing during earthquakes? We’ve seen weirder things….

Animations and Sonifications of the Tohoku earthquake and aftershocks

The M9.0 Tohoku earthquake that roared through Japan on March 11, 2011 made its presence felt in various ways throughout the planet. The ground rippled, the ocean churned, and even the atmosphere undulated with heavy pressure waves as the force of this sudden lurch of the Earth’s crust radiated outward from its source off the coast of Japan.

[Put your headphones on now.]

Scientists all over the world have taken data of all stripes and turned them into illustrative visualizations–like the examples listed above–of the extent of this seismic event. Most of these are old news, but for some reason I thought of them today, so here they are for your illumination.

One of the most captivating effects of this earthquake–and of any–is the aftershock sequence it unleashed. Aftershocks represent the relief of intense local stresses left by the abrupt perturbation of a mainshock, and they unfold in a statistically predictable manner (there’s a fun presentation by USGS scientist Karen Felzer explaining the remarkable features of aftershock sequences here). Despite this statistical order, in our relatively fast-paced human timescale, we may still perceive them as startling and chaotic, especially when we’re on edge in the aftermath of a major quake. Sped-up animations of earthquake occurrence (“seismicity”) help illustrate the decay in frequency and size of aftershocks with time, as well as simply illustrating just how numerous they may be after a large mainshock.

This video shows one year of earthquakes greater than magnitude 4.5 around the globe. Many mainshock-aftershock sequences are apparent, but by far the most spectacular is the series of quakes that is induced by the gargantuan Tohoku earthquake. Enjoy.

This same group has produced several other videos, either covering different time spans, or zooming in to Japan. Have a look at their website:

http://monoroch.net/jishin2011/

One of my favorite videos of this flavor is the “sonification” of seismic records from the day of the quake, like the one at the beginning of this post. Earthquakes shake the ground at frequencies lower than human hearing (infrasonic), but if we simply speed up the playback of seismic records, and translate their motions into oscillation of a speaker cone, we get the “sound” of the earthquakes. In that “sonification” video you see seismograms from four different stations in Japan and Russia that record the mainshock and the onslaught of aftershocks–including a 7.9–that follow. The inset map shows energetic yellow glows surrounding each station that are scaled to reflect the amplitude of the seismic waves recorded there.

If those aren’t enough coolness for you, there’s a whole page of different “sonifications” compiled by a Georgia Tech researcher illustrating different phenomena associated with the monster quake. Several of the clips play regional recordings of the mainshock and its aftershocks, but the compilation continues into recordings from the other side of the planet, where seismometers in California recorded the San Andreas Fault creaking and shuffling with triggered tremor as the long slow elastic waves from Tohoku swept through.

A seismic record section and frequency spectrogram show the first hour following the Tohoku quake. Click the image for the movie with audio. Quicktime format. The link to other videos and formats is below.

Earthquake Sound of the Mw9.0 Tohoku-Oki, Japan earthquake

If you’re into these sorts of things, there are more to be found… The California Integrated Seismic Network has some sped-up recordings of the 2004 M6.0 Parkfield earthquake and its aftershocks, at http://www.cisn.org/special/evt.04.09.28/sounds.html

Amazing liquefaction in Tokyo

A new video from Japan [embedded below] shows liquefaction occurring at a scale and scope that I haven’t seen before in video footage. The video is from Urayasu  town, Chiba Prefecture–an industrial suburb of Tokyo that appears to be sited on made land adjacent to Tokyo Bay. No wonder it sloshes so heavily: made land (fill) is particularly susceptible to liquefaction. We just can’t pack things down the way nature can over millennia.

The video starts in the aftermath of the March 11, 2011 M9.0 Tohoku earthquake, where sediment-filled ground water is bubbling up through gaps in the pavement, or any other fractures that represent escape routes. Within minutes, the M7.9 aftershock hits, and you can see light poles, trees, and buildings shaking violently. All the while, the engineered infrastructure sloshes and bobs, essentially floating on a thick package of fluid-saturated mush. The differential swaying you observe is effectively the dramatic reduction of seismic wave velocity in the loose, fluid-supported substrate. The sound you hear is largely the metal guard rails creaking as they’re stretched and bent. The oscillations last for a very long time.

Liquefaction commonly accompanies large earthquakes in areas where a shallow groundwater table supports suspension of soft soils when it’s shaken. I’ve posted videos of the phenomenon before. It occurs during any earthquake that strikes an area with the right mix of water-saturated sediments. It was widespread throughout Christchurch in each of their big jolts in 2011, and occurred pervasively in the shoreline areas of Japan during their monstrous 2011 quake. Fractures opened during shaking provide conduits for this newly mobile soil slurry to escape surface-ward under the weight of dry material above, producing sand volcanoes, like the one pictured in the righthand image of this blog’s banner.

After watching these videos, it’s clear why this phenomenon results in such destruction, particularly to pipelines and underground utilities. Water main failures may add to the fluid pressure mobilizing all the soil.

When you hear about the danger of living on “fill” and the destruction of liquefaction, these illustrative clips should come to mind.

Spectacular video of Devil’s Hole seiche

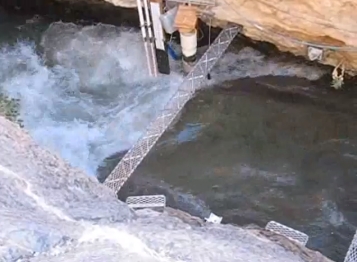
This video is a must-watch. A fortunate National Park Service biologist and a Scientific American reporter interviewing him were standing at a deep natural pool in Death Valley when it began to be dramatically rocked by an earthquake that had occurred 2,000 miles away.

Pond? Not if there's an earthquake on the other side of the planet.

Devil’s Hole is a deep, shaded, natural pool near Death Valley, in Nevada, that is home to some very specialized species of fish and is thus heavily studied. It’s also just the right size to be excited by low frequency “teleseismic” waves from distant earthquakes.

When large earthquakes happen anywhere on the planet, the seismic waves they emit ripple around the globe, detected in most places far from their epicenters only by extremely sensitive instruments. For instance, when the 7.4 earthquake struck the coast of Mexico a few weeks ago, it excited surface waves that raced dramatically beneath our feet in the U.S. imperceptibly to us. By the time seismic waves reach these great distance they are both weak and extremely low-frequency. Sensitive seismometers, however, easily pick up their signal.

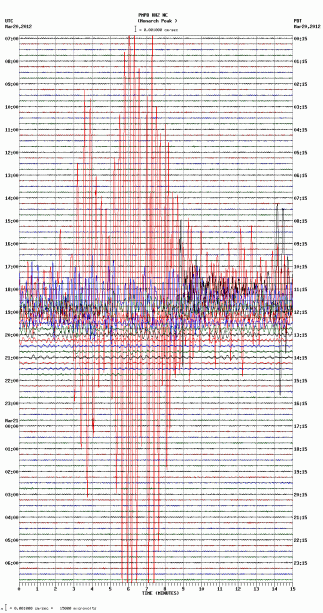
Seismogram from central California (Monarch Peak) showing a 7.4 earthquake in southern Mexico. Note that during the strongest "shaking" the wave crests are ~15 seconds apart. Too slow for us to feel... just right for a small, sloshing pond.

Look at this seismic record from a station in central California on March 20. The M7.4 earthquake dominates the record even though this station is nearly 2,000 miles from the epicenter. The reason people in California weren’t knocked off their feet was that at that distance the seismic waves have a frequency far below anything we could expect to “feel”. If you look at the strongest waves recorded (mostly in red), you’ll see that there are about four peaks per minute, meaning that each wave takes about 15 seconds to pass. What you’re seeing is the ground oscillate back and forth every 7.5 seconds.

Count that out: wayyyy too slow to feel. If, however, you’re a small body of water of just the right size, this is the perfect amount of time to make you slosh over your banks. Think about being in a bathtub: if you shake really fast, the water splashes a little; if you slide very slowly, the water moves smoothly around you; if you swish back and forth at just the right medium speed, however, you can surpass the speed with which water can spill around you, and you end up making it slosh wildly. That’s basically what’s happening in the video above at Devil’s Hole.

Update April 8, 2012: The effect apparent in the video may not be a result of transverse seismic waves causing resonant sloshing, but may stem from compressive waves squeezing the aquifer and causing water level to fluctuate. Similar phenomena are further described on this USGS info page, and the theoretical background is laid out in this review paper in Science.

In the video, the undulation of water level starts around 10-15 minutes after the quake’s origin time. The videographer checks the time at ~18:13, and he’s referring to Coordinated Universal Time. The Quake started in Mexico at 18:02.

It’s really a quite spectacular demonstration of the passage of these very low frequency waves of motion in the rock. You can’t deny they’re happening when the pool beneath you is overflowing its banks!

There’s a nice first-hand narrative of the lucky event here, with a different video from an alternate perspective:

http://www.scientificamerican.com/article.cfm?id=earthquake-at-devils-hole

Mexico City Earthquake Early Warning–it works!

USGS Shakemap based on instrumentally recorded shaking intensity and site conditions. Note the pockets of stronger shaking (green) in sedimentary basins well north of the epicenter.

Want to see what happens when you can know an earthquake is coming? Mexico has footage that’s got you covered.

Update 6 April 2012: They also have an app that alerts you to earthquakes before they hit… in Mexico City. (También tiene una App que se alerta de sismos antes de tiembla!)

On March 20, 2012 a very large earthquake rocked southern Mexico. With a magnitude of 7.4 and a moderate depth of 20km this quake was widely felt, and resulted in damage and casualties near its epicenter in Oaxaca. But Oaxaca wasn’t the only place that got rocked. Mexico City, more than 200 miles north, felt the waves amplified as usual by the lakebed sediments it’s situated upon. The sedimentary basin upon which Mexico City lies is the seismological bane of the city, trapping and amplifying seismic waves like a swimming pool. This unfortunate setting has devastated the city in the past, but is at least widely recognized as a liability. Because the effects of distant earthquakes are amplified in the Distrito Federal, it’s actually an ideal candidate for an early warning system that relies on the time it takes damaging seismic waves to reach a sensitive area once they’ve already been detected. Along with Japan, Mexico is one of the few countries in the world with a functioning early warning system, and last week’s large quake exercised it.

Once large-amplitude shaking is detected among the nation’s seismometers, a signal is transmitted immediately to activate alarms in the capitol city that warn residents shaking may be imminent. Damaging seismic waves travel at a little over 7,000 mph, so at 200 miles from the epicenter, Mexico City would have upwards of a minute and a half of warning before they hit. Of course the seismometers couldn’t detect the seismic waves immediately as they’re initiated, and it would take even more precious seconds before they could reliably identify the quake as a dangerous magnitude, but once they did the alarm was sent.

Footage of a Mexican Senate hearing captured the whole event. A shrill alarm starts going off at the beginning of the video, and the man speaking is interrupted by concerned colleagues who immediately and orderly evacuate the room. The alarm shuts off 50 seconds into the video. Although mild shaking may have begun at this point, capturing the attention of a couple of senators by swinging ceiling fixtures, substantial shaking doesn’t begin until just after the 1:05 mark. From there it clearly continues, noisily rocking light and audio apparati suspended from the ceiling. The electricity flickers on and off a couple times, and the rest of the recording is just the earthquake dying down.

This video is a beautiful demonstration of an earthquake early warning system in action, complete with the successful evacuation of a crowded room. If only we all had the fortune of Mexico City to be hundreds of miles from the earthquakes that plague us.

Bonus video: an extremely fortunate camera crew was set up along the Paseo de la Reforma in Mexico City shooting HD video of a tall statue before the earthquake started. They realize shortly into this video that the ground is swaying, and they capture it all as the towering statue starts oscillating heavily and noisily.

Deformation from the El Mayor Cucapah earthquake: our Science paper

On Friday, February 10, the journal Science published our paper on deformation caused by the M7.2 El Mayor-Cucapah (EMC) earthquake of April 4, 2010. The data we present is the first of its kind at this scale and scope: we have both pre-earthquake and post-earthquake high resolution topographic surveys that cover virtually the entire fault rupture, all 120 km of it. We used both to calculate the topographic change resulting from this large temblor, and present the results in this paper.

The widely publicized oblique view of the post-earthquake topography is colored by direction and amount of vertical motion caused by the earthquake. Blue is down, and red is up. Gradations from light to dark blue represent sagging and warping of the ground, distributed deformation that is not evident without a comparison to pre-quake topography. My field photo at right shows a ground-level view of the same scene. The fault ruptures are prominent, but subtle warping of the ground is difficult or impossible to see.

The bottom line: earthquakes distort the surrounding volume of rock in complex ways that extend beyond our simpler models of fault slip, and understanding the mechanisms that cause faults to slip they way they do requires detailed documentation of this coseismic deformation field. That is to say, high-resolution topographic surveys (in addition to GPS measurements and remote sensing–e.g., satellite imaging–analysis) allow us to see how faults slip during earthquakes, and how they may do so in the future, crucially identifying things like how they may link together to generate larger earthquakes.

As a Science article, this project generated a lot of media attention, and there are plenty of news pieces on it suitable for the lay reader. These generally communicate the broad gist and social importance of the research, but they understandably leave out a lot of the scientifically relevant nuance of our results. “3D Laser Map Shows Before-and-After of an Earthquake” explains what we did and that it’s cool, but it doesn’t address how what we did tells us anything or why it’s cool. Below is a sample of news blurbs about the paper for your basic summary:

UC Davis press releaseNASA homepageScientific AmericanPopular ScienceScience Magazine OnlineThe Daily MailThe Huffington PostOur Amazing PlanetGizmodo

For those of you with true scientific interest in the process of earthquake rupture and its effect on landscapes, I recommend actually reading the article.

“Near-Field Deformation of the El Mayor-Cucapah Earthquake Revealed by Differential LiDAR” – Science

Here’s my somewhere-between-basic-and-technical summary of the findings presented in this paper.

Airborne Laser Swath Mapping is accomplished by recording laser pulses reflected off the ground on a sensitive, GPS and gyroscopically oriented instrument mounted on a plane. Rapid measurements (tens to hundreds of thousands of points per second) allow comprehensive and detailed representation of the ground surface and features on it as a geolocated cloud of points in 3D space.

First of all, we used LiDAR, which stands for “light detection and ranging” and is accomplished by shooting laser pulses at known orientations to ascertain the distance to solid objects, like for instance the ground.

Immediately after the EMC earthquake, a team of scientists with direct and immediate interest in the quake took a helicopter flight over the epicentral region to try and identify which fault had ruptured to cause the temblor. Their aerial reconnaissance identified several major surface breaks along the causative faults of this earthquake, helping pin down the extent of the rupture. Their initial maps were supplemented with satellite-based identification of fault slip in which comparisons of pre- and post-event satellite images revealed major shifts of the ground in opposite directions across the Sierra Cucapah and in the Colorado River Delta. My PhD adviser, Michael Oskin, and colleague Ramon Arrowsmith at Arizona State University leapt at the opportunity to exploit LiDAR to study this earthquake. They appealed to the National Science Foundation for rapid funding of an aerial survey of the rupture zone, and enlisted graduate students (like moi) to compile incoming data on the precise location of fault surface rupture and define the extent of the survey we needed.

Getting funding and permission for an airplane to make low, repeat passes collecting high-resolution 3D scans over another country is a logistical nightmare.

Generous and enthusiastic collaboration between Mexican and U.S. researchers and government agencies provided a crucial bridge to move forward with the project, and in August, four months after the earthquake, a plane mounted with a laser scanner was taking off from the U.S. to scan the rupture zone.

Of course on top of international permissions, there are physical logistics to a mid-summer plane flight over the Sonoran desert, and the mission had a few false starts due to surprising cloudbursts.

A mid-summer desert downburst chases the survey plane back up to the U.S. for the afternoon. Sand particles and laser range-finding don't mix. Juan Carlos Fernández Díaz of the National Center for Airborne Laser Mapping took this photo as they retreated from the day's flight.

The resulting dataset is the largest and highest resolution survey of a large earthquake surface rupture scientists have yet obtained. The raw data and various displayable products (including Google Earth files that I encourage everyone to explore!) are available at OpenTopography.com.

The additional key here is that in 2006, the Mexican Instituto Nacional de Estadística y Geografía (INEGI) had conducted a broad, moderate resolution LiDAR survey of the area around the EMC rupture. This meant that we could measure not only the obvious surface breaks evident in the post-event surveys, but the warping and tilting of the ground that would have been invisible to us without some information about its geometry before being disrupted by the earthquake. So voilà! Both pieces came together and we could easily calculate the coseismic vertical displacement of every 5 x 5 meter patch of ground in a 372 sq km swath around the fault rupture.

The data showed not only the expected vertical displacements across obvious vertical escarpments, but revealed broad bending and warping structures adjacent to and between the main faults. This warping was apparently occurring in the rock mass around the faults, and not along structures that slipped during the earthquake.

Obvious vertical escarpment, along a structure that slipped during the earthquake: the Borrego Fault.

A partial explanation for this observation is the transfer of slip from one fault segment to another. Fault slip in the earthquake should broadly represent a big linear tear in the crust, generating a lobate zone of warped ground where elastic strain that built up before the earthquake was released. However, where the causative fault is discontinuous, slip on one of its segments must decrease to zero and be picked up by the next segment some distance away. This creates a zone of crust that isn’t broken by discrete faults, but has to flex in such a way as to transfer all the slip from one fault across to the other. It is these zones in which we see very high strains, which is unsurprising. We also see high strains leading away from the faults, where the ground has “sagged” and bent downward in a more complex response to slip on geometrically irregular structures below. The bottom line is that the observed flexing is bordering on extreme for the rock here, and we posit that it’s likely that it can’t stay this way without failing. Because we don’t see observable faults (in the LiDAR nor on the ground) that account for this warping, we infer that if these strains do indeed exceed the strength of the rock–that is if they surpass the maximum amount the rock can bend–then they are being accommodated by distributed yielding: permanent, subtle deformation of the rock volume. To make a colloquial analogy, it’s like when your mother would tell you that contorting your face too much would make it get stuck that way. Well that’s what may be happening to these rocks.

That’s where the paper gets speculative, because we don’t know that the strain is high enough to make the rock fail that way and become permanently deformed in this case… all we know is that the strains are that high, and that in cases of other earthquakes, elastic deformation has turned into permanent deformation at strains around this magnitude. In any case, it’s indisputable that a great deal of deformation is happening in the volume of rock surrounding the faults, and not simply on the faults themselves. That’s troubling for people like me who also study ancient past earthquakes, because we’re generally only left with what we can observe on the discrete faults themselves. Subtle warping is difficult to detect in the field, and nearly impossible without precise knowledge of the pre-warping geometry. This may have a huge impact on the assessment of the potential sizes of earthquakes a fault system is capable of producing. By hiding deformation from observable structures, off-fault deformation may lead us to underestimate the size of past earthquakes, and thus to underestimate the hazard for a region.

These results also demonstrate that faults can link together to produce bigger earthquakes than we expect. This is something we have observed for a few decades now, in recent earthquakes like the 1992 Landers, CA M7.3 and the 2008 Wenchuan, China M7.9 just to name a couple. Our new LiDAR dataset adds to the evidence we have of faults linking together, and shows us precisely how they do so by capturing the warping of the ground in between them.

Despite this rupture’s length and overall linearity, it occurred as a compound event resulting from slip on as many as five separate but related fault systems, linked together by zones of severe warping. The deformation field revealed from these before and after surveys underscores the ability of faults to link together and thus highlights the importance of small faults away from a main plate boundary in the seismic hazard of a region. When datasets like this reveal the mechanisms underlying surface faulting they help us understand how fault slip happens and what its effects are on the landscape. With every new earthquake we know more in advance of the next quake. California is primed to produce a wealth of information from its next large earthquakes, because “before” LiDAR surveys have been flown of nearly all of its major faults (literally starting with the B4 data set). The state is like one big earthquake trap, waiting to record precisely what happens along faults in the next major temblor. I’m privileged to have gotten to work on this earthquake that set the stage.