Apologies for the tardiness. I suppose for some of you this is Sunday evening reading, if that’s what people even do on Sunday evenings. Maybe for those of you hunkering down in the U.S. midwest.
Here are two weeks’ worth of seismic tidbits I posted on Twitter, since the first week was a little dry. Catch up on all things quakey!
“The Earthquake Machine” How do you scale down faults so that you can understand their frictional and mechanical behavior in controlled tests? Popular Science has a neato infographic on the equipment used in rock mechanics tests–earthquake laboratories. http://www.popsci.com/technology/article/2013-03/earthquake-machine
Animal earthquake predictors There has been a modest buzz this week about research on a longstanding legend of seismic phenomena. Animals have occasionally been reported to appear to foretell earthquakes, but anecdotal evidence generally fails any rigorous scientific test, and most such observations are thus dismissed as unreliable indicators of any impending quake. Researchers in Germany, however, have begun to study ants that live in colonies along fault lines. Surprising finding: their level of activity changes from a daily average before small tremors. I wouldn’t make too much of this yet, but I think it’s really cool to finally see some potential for scientific tests of a long-standing, intractable myth/puzzle about quake phenomena. Now if only we could fill all our fault lines with German Redwood ants…. I wonder if they distinguish between magnitude 2 and magnitude 7…
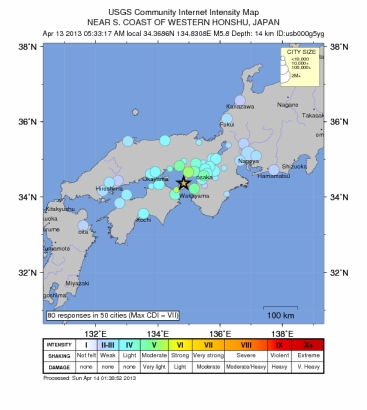
A modest but substantial 5.8 tremor rattled the southern Japanese island of Honshu this week, doing a fair bit of damage on Awaji island and the densely populated area surrounding it. A collection of videos record the shaking from a few urban cameras, the second of which demonstrates the noise created by a rattling city:
YouTube user KOJI PEI posted a video showing a real-time (actually ~2 or 3x speed) animation of shaking intensity at each of Japan’s seismometers during this quake. I’m not sure where this video came from nor how specifically it was generated (it appears to be maximum acceleration averaged over a several second time window), but I’m hoping to find out and to find more like it. You can see seismic waves radiate outward from the epicenter, with the relatively gentle P-waves leading the charge, and swishy S-waves ringing outward behind them.
The principle of base isolation is already successfully applied in buildings around the world, and this mini-version may be hugely popular with companies and museums whose equipement and specimens need to be seismically protected. One of the commenters also has some insightful things to add, including the major deficiencies in maximum displacement and vertical protection.
Big news on a big move this week – I’ll update you all shortly!
Here’s the second installment of my now weekly series in which I compile all the neat-o earthquake things I’ve relayed via Twitter over the prior week.
National Tsunami Week
From March 24-30, the U.S. National Oceanic and Atmospheric Administration (NOAA) and Federal Emergency Management Agency (FEMA) teamed up to raise awareness of tsunami hazard, assembling a huge number of resources. Get informed about the tsunami risk to your coast line, and learn what you should do–I compiled their compilations here.
Earthquake Anniversaries
There were some notable earthquake anniversaries this past week: in 1983 a hefty jolt shook Portland–the “Spring Break quake.” In 1964, the largest earthquake in North America’s modern history, the M9.2 Good Friday earthquake, shook Anchorage for several minutes, jostling loose all kinds of landslides and faults, and sent a massive tsunami racing across the Pacific.
Turkey’s Urban Renewal/Quake Retrofitting Plan Kicks In
Earlier this year, the government of Turkey initiated an urban renewal project in Istanbul that will replace deadly apartment blocks with housing built to withstand their inevitable temblor(s).
www.invest.gov.tr – info from Turkey’s gov’t Earthquake Hazard for Istanbul – blog article summarizing the policy
YouTube’s “EarthquakeVideoMex” compiled a few new videos of earthquake footage, one from a M6.3 in Mexico a few years ago (with some amazing standing waves in an upper story pool):
…and one from the M6.5 that jolted Taiwan earlier this week.
Earthquakes and Cheese
In potentially the most important earthquake-related development of the week, we learned how the Parmagiano-Reggiano industry recovered from a devastating earthquake that struck almost a year ago and wrecked millions of dollars worth of cheese. The Miracle After Italy’s ‘Parmesan Quake’ – WorldCrunch news
See you next week! Or hopefully before then. Happy reading. Join in the fun and get these in real time @TTremblingEarth on Twitter!
On most of the planet this quake would have been unremarkable, but having shaken a population exceeding 7 million people, it earned some remarks. In fact, in the 24 hour period surrounding this earthquake there were 27 of similar or larger magnitude around the world, but this one earned the attention. (That link will probably update with time… if you need convincing you can just set up a “custom data feed” for March 11, 2013.)
The screen grab below shows all M4+ earthquakes that occurred on March 11, 2013. Most of these went unnoticed. Some were felt by many, but didn’t receive the (U.S.) coverage of the SoCal tremor.
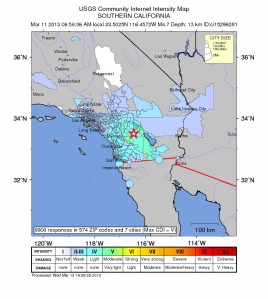
I love seeing the bimodal reactions of southern Californians to an earthquake of this size. No doubt the unnerving sensation of the ground suddenly shuddering beneath you is frightening to many, but there seem to be just as many who could scarcely care less.
Watch as it disrupts (or doesn’t) the coverage of the nearby Indian Wells BNP Paribas Open tennis tournament:
The other interesting facet of the quake was the initial determination of its location and magnitude, which was ironically marred by having a sizeable precursory foreshock, a sizable and immediate aftershock, and great instrumental sensitivity/coverage. At the outset, seismic waves from the foreshock and aftershock, which were separated from the mainshock by 16 and 51 seconds, respectively, tricked the automated system into mislocating the source and origin time of shaking. Initially the USGS identified three earthquakes with magnitudes ranging from 4.7-5.1 that occurred within two minutes of each other. Of course to most of the populace that distinction in the wavetrain would have scarcely been discernable. It was moot anyway, because as the system and seismologists further processed additional data the true sequence of events became clear. A 2.3… 16 seconds… a 4.7… 51 seconds… a 3.0. Meanwhile the shaking from each of those was rippling outward through the L.A. region and desert, overlapping with each other in their rattling. This confusion is an interesting artifact of having a great, quickly responsive seismic network… that’s not quite dense enough to pick out the details of everything it detects right away.
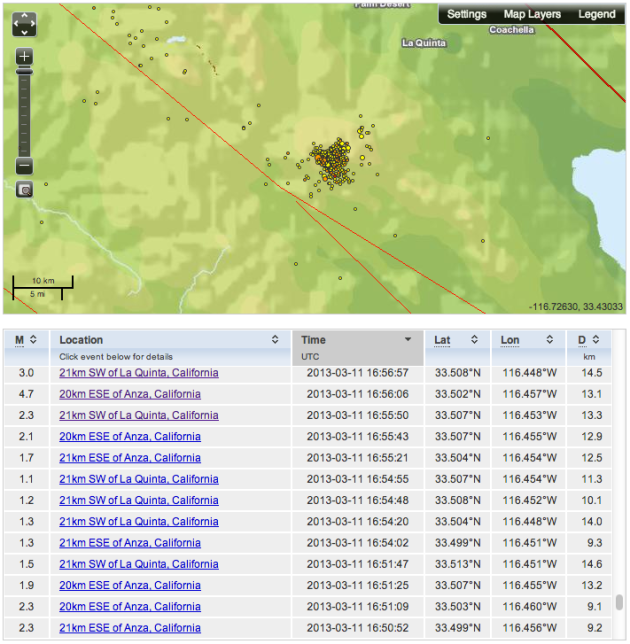
Southern California’s dense seismic network allows detection of minuscule earthquakes, so there is a rich foreshock and aftershock sequence evident surrounding the mainshock hypocenter. Viewing the list of foreshocks makes me intensely curious about the nucleation process of larger earthquakes.
Foreshocks and aftershocks in the 2 days before and after Monday’s quake
The L.A. Times has a good informative piece about the quake and its regional significance as expressed by USGS scientists:
Today is a day of significant quake anniversaries for the U.S. and Japan.
The last U.S. quake to kill more than a few people struck the L.A. suburb of Northridge 19 years ago today, in the wee hours of the morning. The San Fernando Valley was hit hard, but the whole L.A. area rattled violently, and seismic waves from The Valley were focused through the Santa Monica Mountains into the populous west side, an effect that’s apparent in the “Did-You-Feel-It” map if you’re familiar with the geography of L.A (click there for info if you aren’t. Or for fun if you are).
Damage was widespread and many of the area’s freeways shut down for months after major collapses when their concrete supports failed during the strong shaking. Despite the huge monetary cost (right between hurricanes Andrew and Katrina… and potentially behind Sandy) and moderate death toll, this was not Los Angeles’ “big one.” In the scheme of possible So Cal earthquakes, this was a relatively small one, and rather than hitting the core of the city, it struck a glancing blow by starting in the suburbs and sending most of its energy northward into the mountains. Nonetheless it is Angelenos’ clearest reminder (although its age must have erased it largely from modern relevance) of what to expect when a significant quake strikes the city.
Exactly a year later a quake of nearly the same magnitude struck a much more densely populated corner of the planet: Kobe, Japan. This quake, almost identical in magnitude to CA’s Northridge earthquake of the year before, is the source of that quintessential earthquake footage most everyone will be familiar with:
The Kobe quake’s death toll was two orders of magnitude higher than Northridge’s, and the damage to the port city was devastating, largely because of widespread liquefaction, an effect that was much less prevalent in the coarse sedimentary basins of Mediterranean L.A.
As we mark this anniversary of those significant earthquakes, as usual you should take advantage of this heightened awareness to double-check that you’d be ready were a similar quake to happen today. Let the commemoration serve to remind you that these were real events that really happened, and could happen again at any moment.
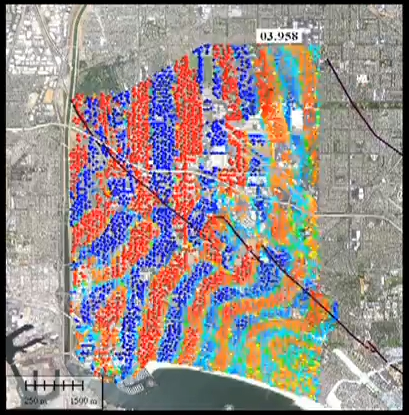
As the seismic waves from a whole host of little earthquakes in L.A. rippled through the basin in 2011, an astonishingly dense array of seismometers deployed in Long Beach captured them in unprecedented detail. Local oil and gas company Signal Hill Petroleum deployed the monitoring instruments in order to conduct an extremely detailed survey of the 3D rock structure beneath their oil fields. Researchers from Caltech and Berkeley struck an agreement with the oil company to share the data for academic research into the earthquake process and details of fault behavior. One of the results of this research is the amazing video below, in which we can see the elastic (seismic) waves of several earthquakes as they propagate from the hypocenter and rock the city block by block. Note that the initial playback is in real time, not sped up or slowed down. Skip around to see each of the 4 quakes without watching all 12 minutes: the individual quakes start at 0:45, 2:20, 6:00, and 8:35.
The seismometers of this network–in this case relatively inexpensive geophones, measuring vertical ground velocity–are located a mere 100 meters apart, creating a network with several instruments per city block! Because of this amazingly dense coverage, we can see the great gory detail of waves of motion moving through the rock underfoot.
In the videos, they have drawn the trace of the Newport-Inglewood Fault, a notable northwest striking strike-slip fault (the source of the 1933 Long Beach earthquake). One of the most notable features of the wavefields displayed in the videos is how drastically this fault zone alters the propagating waves.
Seismic waves from a nearby M2.5 earthquake ripple across the city of Long Beach in this visualization of an unprecedented dense array of seismometers.
When they travel along the fault, they speed up in the fault zone, likely due to alignment of mineral grains and rock structural boundaries in the direction of slip. When the waves have to cross the fault, they get held back and slowed down, forming an irregular jog or knick in the wavefield. This hold-up is probably partially due to that same alignment of grains, now traveling along their short axes, but it’s also due in part to “microslip” along the fault. As the rock on one side bends with elastic waves, the fault accommodates a bit of slip before letting the wave propagate past. The researchers are studying this effect as well, and have begun to map out regions of slip on the N-I fault during adjacent temblors.
It’s rather beautiful, really, to see that this mapped fault has a real physical effect, validating its presence and importance. It’s also endlessly fascinating to watch the details of real seismic wavespassing beneath the city of Long Beach. This is how the ground moves in an earthquake.
More info about the research coming out of this awesome data can be found here:
Update: If you’re now hooked on this kind of visualization, fret not: the Incorporated Research Institutions for Seismology produce these regularly using seismic data from the US Array. Though not at a block-by-block resolution, the animations come from impressive coverage on a spectacularly dense instrumental array, in which you can see the imperceptible seismic waves from distant earthquakes roll beneath the U.S.
The M9.0 Tohoku earthquake that roared through Japan on March 11, 2011 made its presence felt in various ways throughout the planet. The ground rippled, the ocean churned, and even the atmosphere undulated with heavy pressure waves as the force of this sudden lurch of the Earth’s crust radiated outward from its source off the coast of Japan.
[Put your headphones on now.]
Scientists all over the world have taken data of all stripes and turned them into illustrative visualizations–like the examples listed above–of the extent of this seismic event. Most of these are old news, but for some reason I thought of them today, so here they are for your illumination.
One of the most captivating effects of this earthquake–and of any–is the aftershock sequence it unleashed. Aftershocks represent the relief of intense local stresses left by the abrupt perturbation of a mainshock, and they unfold in a statistically predictable manner (there’s a fun presentation by USGS scientist Karen Felzer explaining the remarkable features of aftershock sequences here). Despite this statistical order, in our relatively fast-paced human timescale, we may still perceive them as startling and chaotic, especially when we’re on edge in the aftermath of a major quake. Sped-up animations of earthquake occurrence (“seismicity”) help illustrate the decay in frequency and size of aftershocks with time, as well as simply illustrating just how numerous they may be after a large mainshock.
This video shows one year of earthquakes greater than magnitude 4.5 around the globe. Many mainshock-aftershock sequences are apparent, but by far the most spectacular is the series of quakes that is induced by the gargantuan Tohoku earthquake. Enjoy.
This same group has produced several other videos, either covering different time spans, or zooming in to Japan. Have a look at their website:
One of my favorite videos of this flavor is the “sonification” of seismic records from the day of the quake, like the one at the beginning of this post. Earthquakes shake the ground at frequencies lower than human hearing (infrasonic), but if we simply speed up the playback of seismic records, and translate their motions into oscillation of a speaker cone, we get the “sound” of the earthquakes. In that “sonification” video you see seismograms from four different stations in Japan and Russia that record the mainshock and the onslaught of aftershocks–including a 7.9–that follow. The inset map shows energetic yellow glows surrounding each station that are scaled to reflect the amplitude of the seismic waves recorded there.
If those aren’t enough coolness for you, there’s a whole page of different “sonifications” compiled by a Georgia Tech researcher illustrating different phenomena associated with the monster quake. Several of the clips play regional recordings of the mainshock and its aftershocks, but the compilation continues into recordings from the other side of the planet, where seismometers in California recorded the San Andreas Fault creaking and shuffling with triggered tremor as the long slow elastic waves from Tohoku swept through.
A seismic record section and frequency spectrogram show the first hour following the Tohoku quake. Click the image for the movie with audio. Quicktime format. The link to other videos and formats is below.
If you’re into these sorts of things, there are more to be found… The California Integrated Seismic Network has some sped-up recordings of the 2004 M6.0 Parkfield earthquake and its aftershocks, at http://www.cisn.org/special/evt.04.09.28/sounds.html
A new video from Japan [embedded below] shows liquefaction occurring at a scale and scope that I haven’t seen before in video footage. The video is from Urayasu town, Chiba Prefecture–an industrial suburb of Tokyo that appears to be sited on made land adjacent to Tokyo Bay. No wonder it sloshes so heavily: made land (fill) is particularly susceptible to liquefaction. We just can’t pack things down the way nature can over millennia.
The video starts in the aftermath of the March 11, 2011 M9.0 Tohoku earthquake, where sediment-filled ground water is bubbling up through gaps in the pavement, or any other fractures that represent escape routes. Within minutes, the M7.9 aftershock hits, and you can see light poles, trees, and buildings shaking violently. All the while, the engineered infrastructure sloshes and bobs, essentially floating on a thick package of fluid-saturated mush. The differential swaying you observe is effectively the dramatic reduction of seismic wave velocity in the loose, fluid-supported substrate. The sound you hear is largely the metal guard rails creaking as they’re stretched and bent. The oscillations last for a very long time.
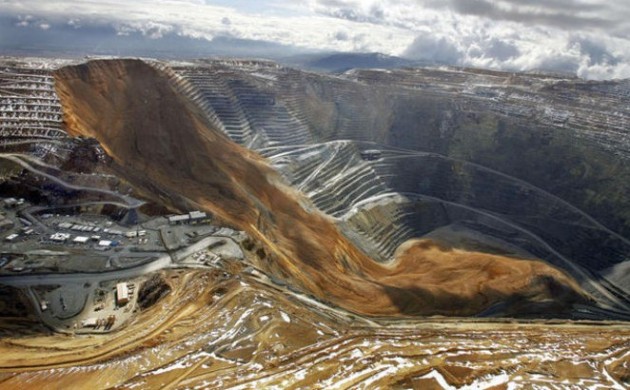
Liquefaction commonly accompanies large earthquakes in areas where a shallow groundwater table supports suspension of soft soils when it’s shaken. I’ve posted videos of the phenomenon before. It occurs during any earthquake that strikes an area with the right mix of water-saturated sediments. It was widespread throughout Christchurch in each of their big jolts in 2011, and occurred pervasively in the shoreline areas of Japan during their monstrous 2011 quake. Fractures opened during shaking provide conduits for this newly mobile soil slurry to escape surface-ward under the weight of dry material above, producing sand volcanoes, like the one pictured in the righthand image of this blog’s banner.
After watching these videos, it’s clear why this phenomenon results in such destruction, particularly to pipelines and underground utilities. Water main failures may add to the fluid pressure mobilizing all the soil.
When you hear about the danger of living on “fill” and the destruction of liquefaction, these illustrative clips should come to mind.
Saturday [November 3, 2012] marked the ten-year anniversary of the largest quake to hit the U.S. since 1964, and the 1906 SF quake before that. The M7.9 Denali earthquake tore a ~250 mile gash through Alaskan glaciers and pine forests along the Denali Fault, which runs beside the eponymous mountain also known as Mt. McKinley, North America’s highest peak.
A detailed topographic survey of the rupture reveals fresh scarps along the sharp linear trace of the fault where it has been offsetting river valleys for millennia, one earthquake at a time. The fault runs from upper left to lower right across this image, and the large deflections of each canyon represent the cumulative result of dozens of 2002-sized earthquakes. This data set is available to view in Google Earth from http://www.OpenTopography.org
Much like the Haida Gwaii earthquake last week, the Denali quake shook mainly sparsely populated areas, so it was much more probable that anyone feeling it would be on the outer fringes of the shaking from the massive temblor. Indeed footage from a home in Anchorage, 160 miles from the epicenter, shows slow rocking–that telltale sign that some place moderately far from you is really getting hammered. Despite the low frequency of the shaking in this video, its strength is clear, and it lasts a very long time–another sign that you’re on the fringes of a huge earthquake.
One of the many legacies of this earthquake was that it put the trans-Alaska oil pipeline to the test. The pipeline crosses the Denali fault nearly perpendicularly, and was constructed with the knowledge and anticipation of offset along the fault. For ~1,000 feet on either side of the fault, the pipeline’s supports rest in tracks that allow it to shift laterally and bend as the ground beneath it carries the tracks in opposite directions. The structure was designed anticipating an earthquake of magnitude 8.0 with 20 feet of coseismic lateral displacement. At nearly the anticipated size, the Denali quake was a resoundingly successful test of earthquake engineering, which spared us an enormous environmental disaster.
A comparison of the 2002 Denali and 1857 San Andreas fault ruptures. The modern recordings from Alaska help guide our expectations about a contemporary repeat of the southern California quake.
Both its size and its geometry suggest that this rupture may be an excellent modern analogue to the earthquake that ripped along the San Andreas Fault in 1857, before southern California was heavily populated. It thus serves as an excellent source of modern data (seismic recordings, satellite imaging, GPS velocities) to help understand what a repeat of the San Andreas rupture will be like. For example, seismic records from the Denali quake are used in structural engineering tests of seismic safety design, simulating the type of shaking that may be expected around Los Angeles in the next SAF quake.
A tree, taking advantage of the groundwater source along the Denali fault, suffers the consequences of its opportunism. Photo credit: Peter Haeussler, USGS.
Last weekend a large quake rocked the Pacific Coast of Canada. In my post about it I mentioned that not much footage had surfaced. There’s still rather little, largely–I suspect–because of the quake’s remote epicenter. Nonetheless it was a very large quake, so the distant, low-frequency waves swung chandeliers and played with people’s balance across western Canada. The videos people have posted so far are collected in the compilation below. In all but the last, the quiet, slow rocking indicates substantial distance from the source of the shaking (that is to say, ~the epicenter). The last video appears to be much nearer the epicenter given the relatively high frequency and violence of the shaking (skip to 3:00 minutes in the video if you’re eager to just that exciting part).
Earthquakes’ high-frequency energy gets dissipated quickly as they ripple outward, relative to the long-period, low-frequency waves. You observe this effect when a car drives by you with the bass thumpin’: you hear (or feel!) the deep resonant rhythm, but unless you’re inside the car, you can’t hear the high-pitched song going on above it, which gets absorbed by vibration of the car parts.
Slow rocking is a tell-tale sign that a big earthquake is going on and that you’re very far from its epicenter.
On Tuesday evening (Oct. 16, 2012) just after 7pm Eastern a modest quake rippled out from a few kilometers beneath Maine.
At a meager 4.0 the quake was quite harmless, but it was a surprising jolt for a rather large region not accustomed to periodic tremors. Cameras filming all manner of council meetings captured the interruption.
In most views the quake is only apparent as a light noise and mild rattling (“I’ve never been in an earthquake my whole life and that was it?” says one woman), but in at least one of them–presumably much closer to the epicenter than the others–the room suffers a sizable jolt that sends its occupants scurrying (by the way: not what to do).
Although the rattled populace (including most of New Hampshire, much of Vermont, upstate New York, and the Boston metro area) reacted with mild alarm and substantial disbelief, New England is no stranger to earthquakes. As the USGS explains, Boston and New York have been rattled by earthquakes since before America was America, including damaging earthquakes in 1638, 1737, 1755, and 1884. Central New Hampshire suffered a moderate (M5.6) quake in 1940, and let’s not forget the M5.2 that rocked a region around upstate New York in 2002. As with most quakes around this region, this one likely resulted from reactivation of an ancient seam in the crust, long dormant but tweaked just right by the complex and evolving stresses across the continent. These minor quakes pop off quite irregularly and of course unpredictably.
For a more comprehensive list of earthquakes in your New England state, have a look at the USGS’s state earthquake history pages. They’re not as rare as you think!
I'm a Ph.D. student in earthquake geology, using topographic and stratigraphic investigation to unravel the seismic history and dynamic behavior of continental faults. I get excited about all things seismological, and I bring them to you here.


 Big quakes in the past week
