As the seismic waves from a whole host of little earthquakes in L.A. rippled through the basin in 2011, an astonishingly dense array of seismometers deployed in Long Beach captured them in unprecedented detail. Local oil and gas company Signal Hill Petroleum deployed the monitoring instruments in order to conduct an extremely detailed survey of the 3D rock structure beneath their oil fields. Researchers from Caltech and Berkeley struck an agreement with the oil company to share the data for academic research into the earthquake process and details of fault behavior. One of the results of this research is the amazing video below, in which we can see the elastic (seismic) waves of several earthquakes as they propagate from the hypocenter and rock the city block by block. Note that the initial playback is in real time, not sped up or slowed down. Skip around to see each of the 4 quakes without watching all 12 minutes: the individual quakes start at 0:45, 2:20, 6:00, and 8:35.
The seismometers of this network–in this case relatively inexpensive geophones, measuring vertical ground velocity–are located a mere 100 meters apart, creating a network with several instruments per city block! Because of this amazingly dense coverage, we can see the great gory detail of waves of motion moving through the rock underfoot.
In the videos, they have drawn the trace of the Newport-Inglewood Fault, a notable northwest striking strike-slip fault (the source of the 1933 Long Beach earthquake). One of the most notable features of the wavefields displayed in the videos is how drastically this fault zone alters the propagating waves.
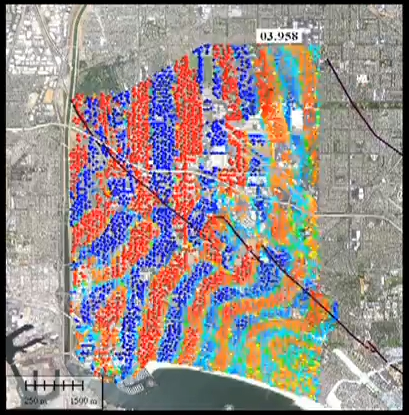
Seismic waves from a nearby M2.5 earthquake ripple across the city of Long Beach in this visualization of an unprecedented dense array of seismometers.
When they travel along the fault, they speed up in the fault zone, likely due to alignment of mineral grains and rock structural boundaries in the direction of slip. When the waves have to cross the fault, they get held back and slowed down, forming an irregular jog or knick in the wavefield. This hold-up is probably partially due to that same alignment of grains, now traveling along their short axes, but it’s also due in part to “microslip” along the fault. As the rock on one side bends with elastic waves, the fault accommodates a bit of slip before letting the wave propagate past. The researchers are studying this effect as well, and have begun to map out regions of slip on the N-I fault during adjacent temblors.
It’s rather beautiful, really, to see that this mapped fault has a real physical effect, validating its presence and importance. It’s also endlessly fascinating to watch the details of real seismic wavespassing beneath the city of Long Beach. This is how the ground moves in an earthquake.
More info about the research coming out of this awesome data can be found here:
Update: If you’re now hooked on this kind of visualization, fret not: the Incorporated Research Institutions for Seismology produce these regularly using seismic data from the US Array. Though not at a block-by-block resolution, the animations come from impressive coverage on a spectacularly dense instrumental array, in which you can see the imperceptible seismic waves from distant earthquakes roll beneath the U.S.
Can you provide some sense of what the magnitude of the vertical displacement is? As a non-seismologist I have a hard time picturing what this movement would mean to someone on the ground.
That’s a good question. Without the raw seismic data (nor any scales or legends in the animations) it’s essentially impossible to give you the real answer. However, we can make some basic inferences based on the size of the quakes alone. The geophones whose data is plotted record ground velocity, which is not a particularly useful quantity for intuiting the perception of shaking–forces are induced by changes in velocity, in our inertial universe, so it’s the accelerations that lead to what you “feel.” Nonetheless ground velocities generally scale with the magnitude of earthquakes, and so have been empirically correlated with perceived shaking intensity. For example, we can look at the USGS “shakemap” for the 3.4 in Compton (final quake in the video), http://earthquake.usgs.gov/earthquakes/shakemap/sc/shake/14996748/
which suggests the peak velocities around Long Beach were probably 1cm/s or less, so that’s probably near the saturation point of the color scale they’re using in the animations.
Basically, with earthquakes of the magnitude you’re seeing plotted here (~2.5-3.5), the general sensation is often that of a heavy truck passing, or construction going on nearby–just a light quick rumble. The waves in the video reveal what creates that rumble–you’re literally riding those quick-moving ripples of the ground, which in this case are pretty small.
I think it’s spectacularly neat that even with such small amplitudes these waves are coherent and detectable.
Nodal Seismic ( http://www.nodalseismic.com/ ) was the company contracted by Signal Hill Petroleum to deploy the geophones and conduct the reflection survey. I don’t know what the current status of the project is, i.e., whether or not they’re still deployed. Ah what you can do with money. It’s great that SHP agreed to share the seismic data with academic researchers.
Darn, you’re right! They must have removed it. I’ll hunt around and see if I can track down a public version of it. It’d be tragic to lose access to something so cool….
I see a doctor in Long Beach, who office is on Anaheim. I am noticing changes when I walk to his office, Like a hill growing, streets cracking. At my home in Downey the sunroom is seperating from the rest of the house, the sunroom is moving toward the right, and will take the rest of the house with it. How fast is Newport-Inglewood creeping?
Newport-Inglewood is a threatening fault line, but it’s not moving so fast that you’d notice a hill growing! I suspect some of the cracking and changes you recognize are simply settling and weathering of engineered structures. Roads may crack for any number of non-tectonic reasons including compaction of the fill, wear by heavy traffic, wear by seasonal hot-cold/wet-dry cycles, etc. Fault-related cracking would be located systematically above a creeping fault, and the NIF hasn’t exhibited surface creep. It’s also a ways southwest of Downey. Furthermore, the NIF around the latitude of the south coast and Orange County has well established Alquist-Priolo setback zones, so it’s unlikely that your Downey home is being wrenched apart by it… You can check out a closeup map of where it goes from the California Geological Survey: http://www.quake.ca.gov/gmaps/ap/ap_maps.htm (here’s a pdf of your area http://gmw.consrv.ca.gov/shmp/download/ap/pdf/LOSALAMITOS.PDF )
…or explore it in Google Earth: http://earthquake.usgs.gov/hazards/qfaults/google.php
Thank you for you response. Yes, that part of Long Beach is old. I wish the fault was tearing the sunroom apart from the rest of the house, but my parents paid only $5000. You pay for what you get. An Earthquake on any near by fault would save my sister and I the money of tearing down the sunroom. Of course C-4 would do the samething. (Joke). Is the city of Downey near any faults?
Haha, yes, during an internship I did at the USGS a decade ago I answered the phones for a spell and it was common for people to call in trying to find some tectonic excuse for their insurance claims. :-P Where are the quakes when you need ’em??
Downey doesn’t have any big surface-breaking faults through it, but north-south compression across the L.A. Basin is driving slow deformation along a deep, buried thrust fault, the Puente Hills fault that you may have heard of. Here’s a little info about it. ( http://www.scec.org/research/030404dolan.html )
You’re bound to hear it in the news at some point; it’s viewed as one of the biggest eq threats to L.A. and it basically underlies the entire place because it’s closer to horizontal than vertical like the Newport-Inglewood.
I'm a Ph.D. student in earthquake geology, using topographic and stratigraphic investigation to unravel the seismic history and dynamic behavior of continental faults. I get excited about all things seismological, and I bring them to you here.
 Big quakes in the past week

Can you provide some sense of what the magnitude of the vertical displacement is? As a non-seismologist I have a hard time picturing what this movement would mean to someone on the ground.
That’s a good question. Without the raw seismic data (nor any scales or legends in the animations) it’s essentially impossible to give you the real answer. However, we can make some basic inferences based on the size of the quakes alone. The geophones whose data is plotted record ground velocity, which is not a particularly useful quantity for intuiting the perception of shaking–forces are induced by changes in velocity, in our inertial universe, so it’s the accelerations that lead to what you “feel.” Nonetheless ground velocities generally scale with the magnitude of earthquakes, and so have been empirically correlated with perceived shaking intensity. For example, we can look at the USGS “shakemap” for the 3.4 in Compton (final quake in the video), http://earthquake.usgs.gov/earthquakes/shakemap/sc/shake/14996748/
which suggests the peak velocities around Long Beach were probably 1cm/s or less, so that’s probably near the saturation point of the color scale they’re using in the animations.
Basically, with earthquakes of the magnitude you’re seeing plotted here (~2.5-3.5), the general sensation is often that of a heavy truck passing, or construction going on nearby–just a light quick rumble. The waves in the video reveal what creates that rumble–you’re literally riding those quick-moving ripples of the ground, which in this case are pretty small.
I think it’s spectacularly neat that even with such small amplitudes these waves are coherent and detectable.
That was unlike anything I’ve ever seen before. Who runs all of the geophones?
Nodal Seismic ( http://www.nodalseismic.com/ ) was the company contracted by Signal Hill Petroleum to deploy the geophones and conduct the reflection survey. I don’t know what the current status of the project is, i.e., whether or not they’re still deployed. Ah what you can do with money. It’s great that SHP agreed to share the seismic data with academic researchers.
Pingback: Watch how the ground really moves during an earthquake
Pingback: Video Interlude: Watch How the Long Beach Ground Moves During a ‘Quake | My Blog
Pingback: Visualizing Seismic Waves | GEOGRAPHY EDUCATION
Unfortunately the video comes up saying it is private. Pity as I would have liked to watch. Could it be because I am in Ireland rather than the US?
Darn, you’re right! They must have removed it. I’ll hunt around and see if I can track down a public version of it. It’d be tragic to lose access to something so cool….
Phew! I replaced it! Also, you can find more animations on the associated academic site: http://www.gps.caltech.edu/~clay/LB3D/EQmovies.html
Thanks
I see a doctor in Long Beach, who office is on Anaheim. I am noticing changes when I walk to his office, Like a hill growing, streets cracking. At my home in Downey the sunroom is seperating from the rest of the house, the sunroom is moving toward the right, and will take the rest of the house with it. How fast is Newport-Inglewood creeping?
Newport-Inglewood is a threatening fault line, but it’s not moving so fast that you’d notice a hill growing! I suspect some of the cracking and changes you recognize are simply settling and weathering of engineered structures. Roads may crack for any number of non-tectonic reasons including compaction of the fill, wear by heavy traffic, wear by seasonal hot-cold/wet-dry cycles, etc. Fault-related cracking would be located systematically above a creeping fault, and the NIF hasn’t exhibited surface creep. It’s also a ways southwest of Downey. Furthermore, the NIF around the latitude of the south coast and Orange County has well established Alquist-Priolo setback zones, so it’s unlikely that your Downey home is being wrenched apart by it… You can check out a closeup map of where it goes from the California Geological Survey:
http://www.quake.ca.gov/gmaps/ap/ap_maps.htm (here’s a pdf of your area http://gmw.consrv.ca.gov/shmp/download/ap/pdf/LOSALAMITOS.PDF )
…or explore it in Google Earth:
http://earthquake.usgs.gov/hazards/qfaults/google.php
Thank you for you response. Yes, that part of Long Beach is old. I wish the fault was tearing the sunroom apart from the rest of the house, but my parents paid only $5000. You pay for what you get. An Earthquake on any near by fault would save my sister and I the money of tearing down the sunroom. Of course C-4 would do the samething. (Joke). Is the city of Downey near any faults?
Haha, yes, during an internship I did at the USGS a decade ago I answered the phones for a spell and it was common for people to call in trying to find some tectonic excuse for their insurance claims. :-P Where are the quakes when you need ’em??
Downey doesn’t have any big surface-breaking faults through it, but north-south compression across the L.A. Basin is driving slow deformation along a deep, buried thrust fault, the Puente Hills fault that you may have heard of. Here’s a little info about it. ( http://www.scec.org/research/030404dolan.html )
You’re bound to hear it in the news at some point; it’s viewed as one of the biggest eq threats to L.A. and it basically underlies the entire place because it’s closer to horizontal than vertical like the Newport-Inglewood.